Here are the figures from the Greater South Bend-Mishawaka Area MLS:
- March: 251 closed sales, volume of ~ $24.9 million
- April: 279 closed sales, volume of ~$32.6 million (edited from previously reported numbers due to late input of some closed sales)
- May: 334 closed sales, volume of ~$43.8 million
- June: 319 closed sales, volume of ~$45.3 million
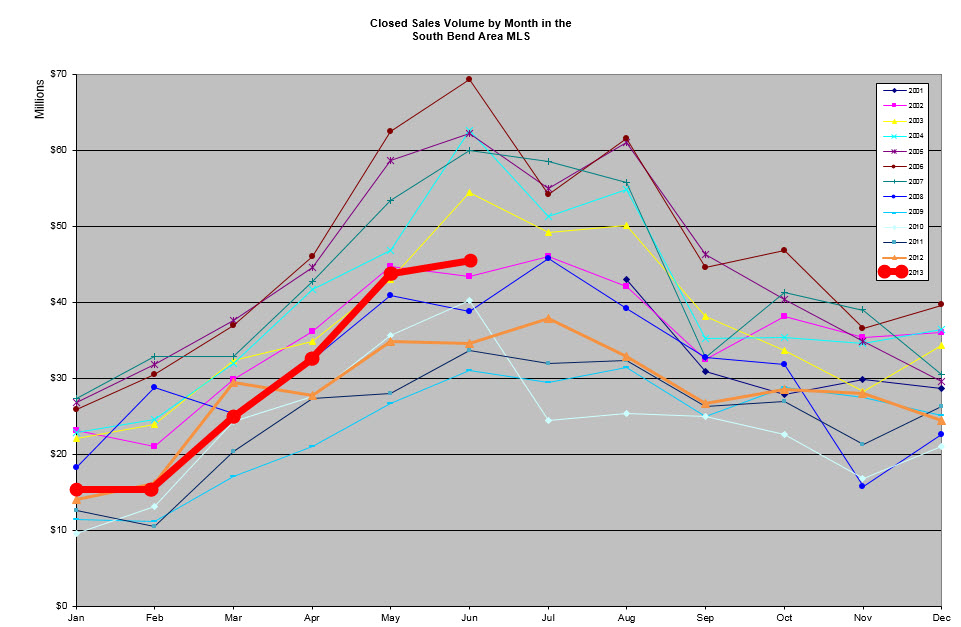
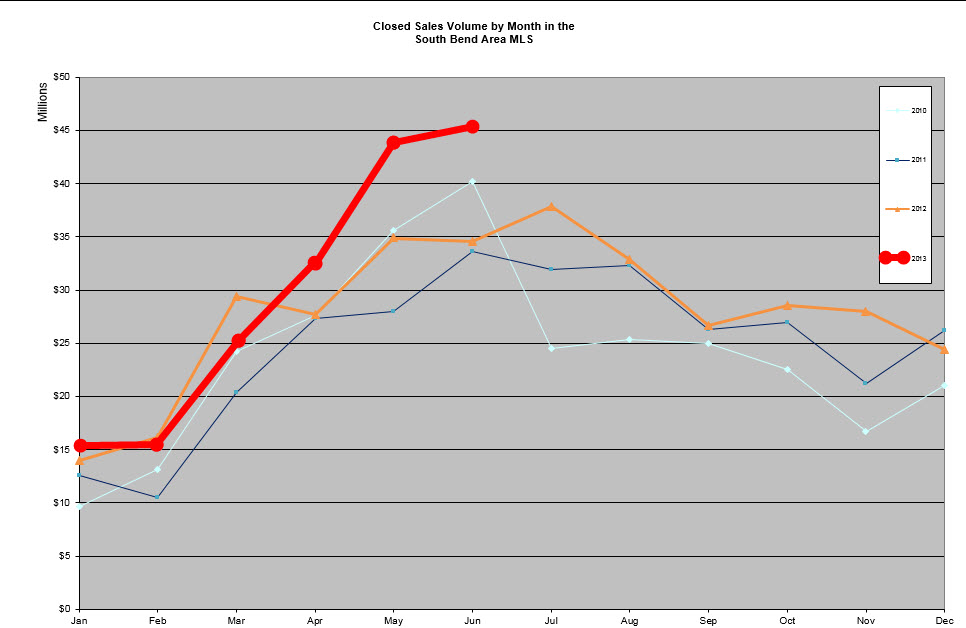
Real estate sales volume by month
January 2001 – June 30, 2013
Only January 2010 – June 30, 2013
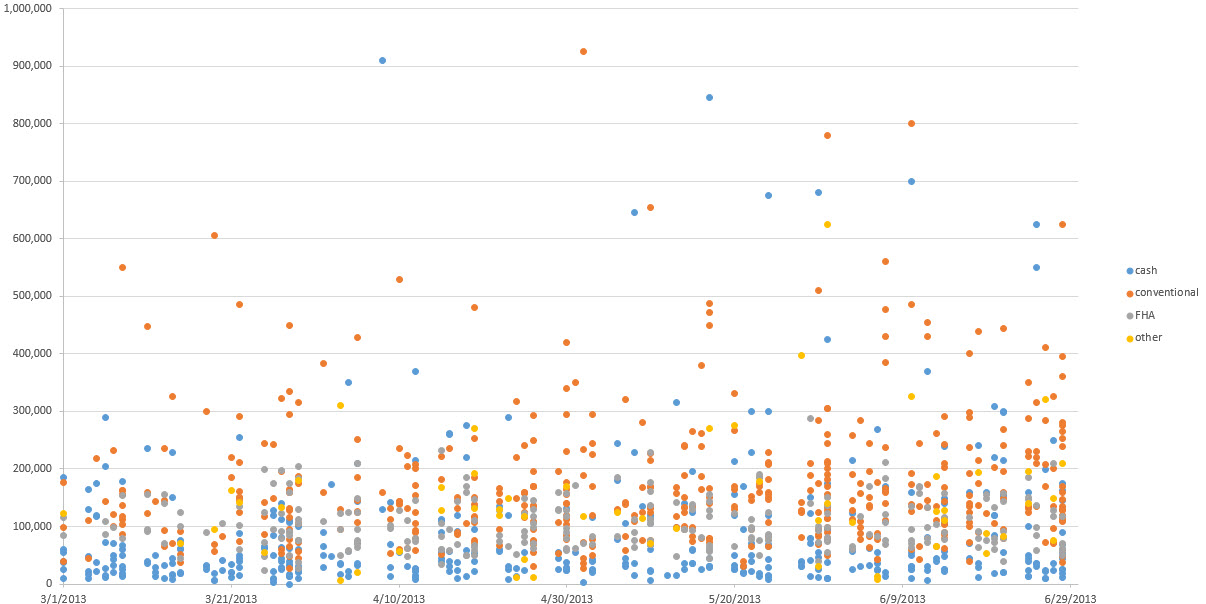
Every sale recorded in the Greater South Bend – Mishawaka MLS for March, April, May and June 2013:
Sales at all prices
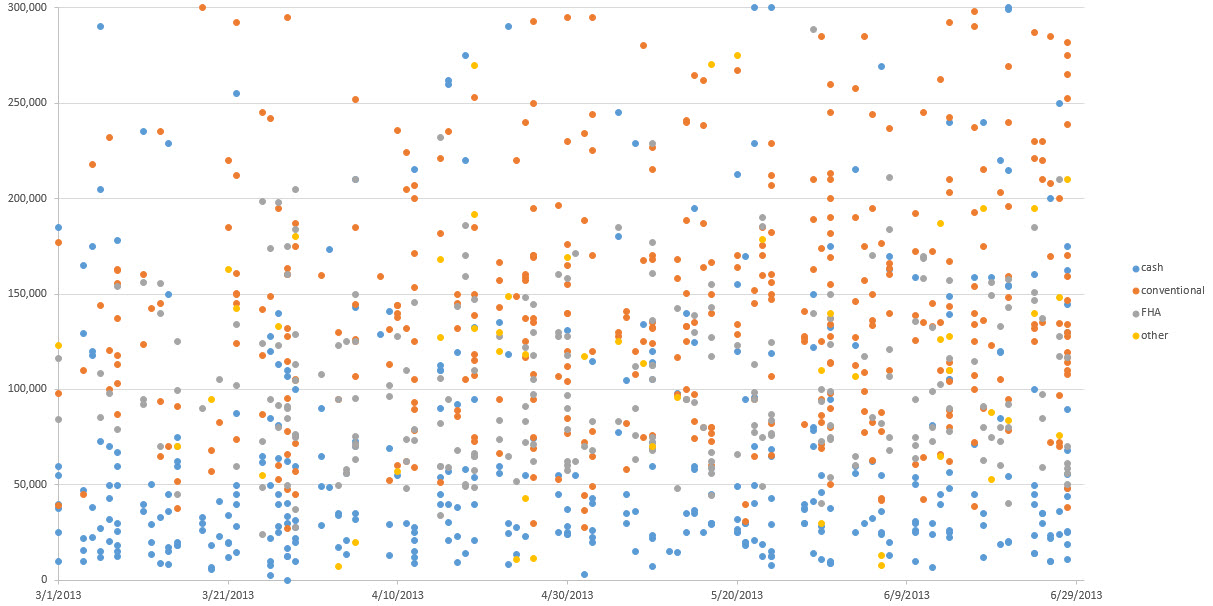
Sales up to $300k
(this includes greater than 95% of closed sales)
These are useful statistics to get an idea of the overall market in and near South Bend. But before you buy be sure you drill down to a tighter data set.
Knowing that sales are up in the South Bend area is not enough to be an informed player in the market. You need to know what has happened within a half a mile, on the next block, and in the house two doors down. And you should know the trends and why that part of the larger market is performing well or poorly. Then you can make smart decisions. Call me if you want a more specific analysis.