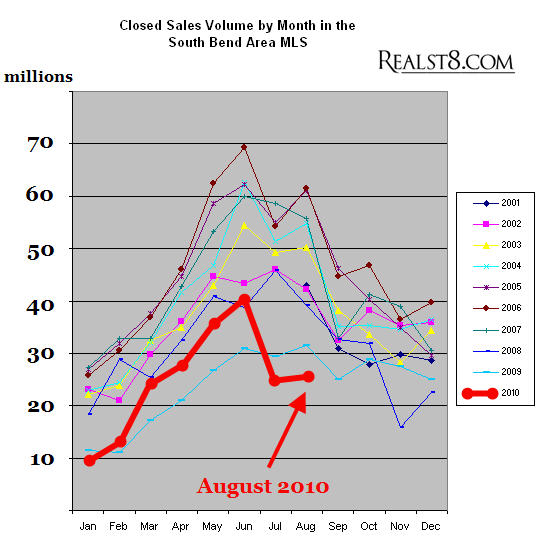
The South Bend Area MLS records show that in August 2010:
- 234 residential properties were sold
- 268 residential properties went under contract
- 495 residential properties were newly listed or re-listed for sale (that is not a count of all homes for sale, just those listed in August. There are 2,459 homes listed for sale in the SB MLS as I write this)
The 234 sales add up to $25.43 million in volume. That is about 3% higher than in July 2010 and about 20% lower than in August 2009.
Here is the long term graph

Real Estate Sales Prices
The high price sale for August 2010 was 1222 Erskine Manor Hill in South Bend’s Erskine Manor neighborhood. It sold for $550,000 on 8/24/10.
Other high price sales were
- 522 Kamm Island Place at the Townes at Kamm Island for $491,856
- 51340 Carrigan Way in Covington Shores for $490,000
- 51308 Harbor Ridge Drive in Covington Shores at $456,500
- 1504 Colfax in South Bend at $425,000
There were 16 sales below $10,000 and 86 sales below $50,000.
Here are all the sales prices at a glance

Financing
FHA sales were a smaller but still significant force in the market in August. Cash sales continue to dominate the lower price sales and conventional financing the higher price sales.

More Questions?
If you are considering the purchase or sale of property in the South Bend – Mishawaka – Granger – Notre Dame Area and want a no-pressure, no-hassles consultation with the Realtors behind the South bend Area Real Estate Blog, please contact us. We’re friendly and candid and if we can’t help you, we can probably point you in the right direction. Also, watch for more details on sales in niche markets like Notre Dame condos and new construction homes in coming posts, or feel free to ask questions in the comments.

Thanks for the update!!! Look forward to the September numbers in a few days…
From the August numbers, things look terrible for Michiana real estate. Inventory just isn’t moving. Who would have guessed things would be this anemic? Sadly, the rest of the year will be more of the same…
Any update on the ND area sales??? What about new home sales???
Sadly, too, after the complete spanking Stanford gave ND, BK won’t help with real estate sales (did he buy a house, or is he wise and just renting???)…nor help hotels, restaurants, etc. Argh. … will ND sellout all of its games (even with giving tickets to large youth groups, etc. apparently someone…some mysterious “person”….buys up tickets when it really isn’t a sellout and donates them to local charities to give kids a chance to attend a game….ah, seat fillers).
The closed sales volume by month graph that goes back to 2001 is probably the most interesting graph to review and see trends. What would also be interesting is the graph in linear timeline format instead of the years being layered on top of each other…that is, one continuous graph from 2001 until the present. Even more interesting would be the sales numbers in a linear timeline format adjusted for inflation….2010 would then be way below 2001….. Perhaps you could post a spread sheet of the numbers?
Best wishes.
Interesting. I’ve started looking into this and may develop it into a full analysis this winter when I have more time. Here is the graph I came up with using an online inflation calculator: http://bit.ly/SB-MLS-Monthly-Sales-Inflation-Adjusted
How are the September 2010 numbers looking???
At first glance, they are comparable to the August numbers. Full report coming later this weekend. Today is too nice for statistics so we are headed to the lake.
I hope you didn’t drown since you never posted the stats! LOL Just kidding…but, do hope all is well and that you had a great weekend before the weather turns cold!