The South Bend Area MLS records reflect that:
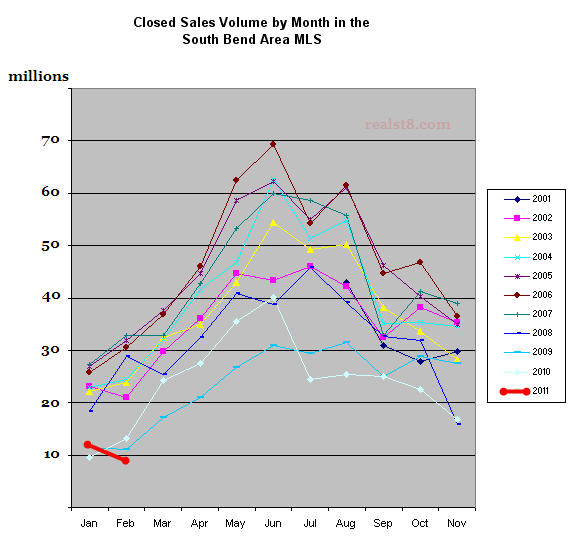
- In January 2011, there were 138 sales for ~ $12.1 million in volume.
- In February 2011, there were 124 sales for ~ $10 million in volume.
Those numbers are much lower than 2001-8 , though they do compare with 2009 and 2010, see the long term graph below.
Personally, I am starting to see a considerable increase in “activity,” with potential buyers wanting to see condos or houses and homeowners investigating listing their properties for sale. But there is still a considerable gap between buyer and seller price expectations, which is keeping the number of actual sales low.
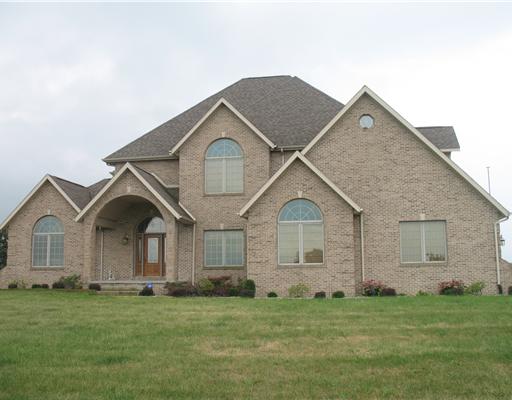
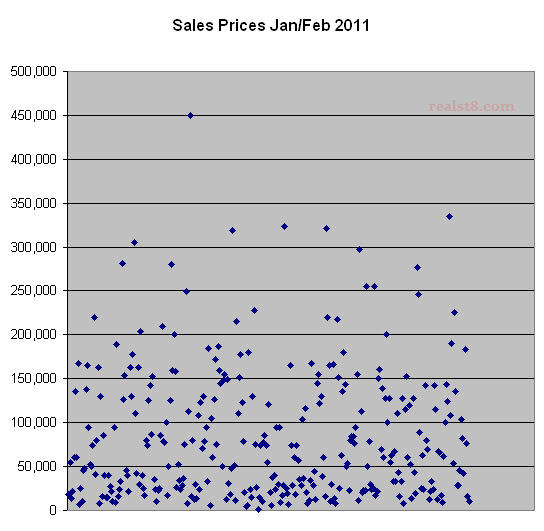
The high price sale so far this year is 13336 Kern Road in Mishawaka. It’s a 3,316 square foot 4 bedroom, 2.5 bath home on 20 acres. It was listed for $700,000 in September 2010 and sold for $450,000 January 25th, 2011.

Here is a scatter graph, reflecting every reported sales price for January and February 2011:

and here is the long term graph of monthly sales volume:


Here’s to hoping that you see that big upswing in Spring!
Any updates for March, April and May?
I plan to post the full sales report early next week. But we’ve just crossed $100 million in sales through the MLS for the year. Here are the last few months:
March: 201 sales for $20.41m
April: 228 sales for $27.28m
May: 243 sales for $28.01m