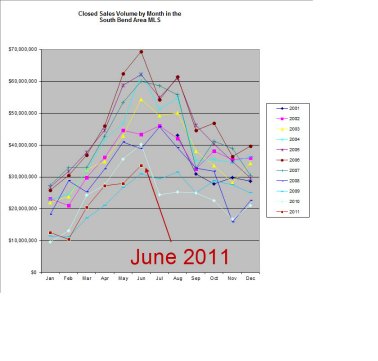
There are records in the Greater South Bend – Mishawaka MLS for 286 sales totaling $33,621,366 closing in June 2011. That is up from the roughly $28m sold in May, but down from June 2010’s ~$40.2m. Note that June 2010 was the last month to have sales inflated by the homebuyer’s tax credit and June 2011 saw the highest sales volume since that month.
Here is the long term graph of monthly sales volume.
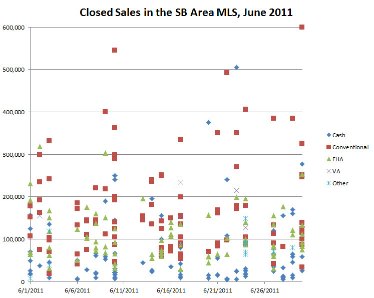
Here are all the June sales on a single graph. They are broken out by type of financing (conventional loan, FHA loan, cash purchase, etc.)
The high price sales were:
- 14234 Shoreline Drive in Granger’s Covington Shores, a 3809 square foot, 4 bedroom, 4+1 bath home that was listed for sale and sold at $600k.
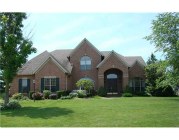
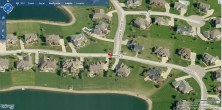
- 2323 Topswood Lane in South Bend’s Topsfield, a 4,500 square foot, 5 bedroom, 4+2 bath home that was listed for sale in March 2010 at $623,900 and sold for $545,000 with $1,500 in seller concessions. It last sold in December 2001 at $430k.
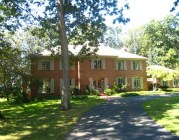
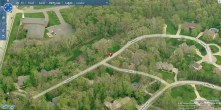
- 1247 Notre Dame Ave in South Bend’s University Heights, a 3,776 square foot 6 bedroom, 5 bath home that was listed for sale in February 2011 at $900k and sold for $505,000.
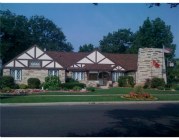
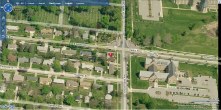
- 18155 Baldwin Drive in South Bend’s Bradford Shores, a 2,311 square foot, 1 bedroom, 2+1 bath home (plus 2 bedrooms and 1 bath in a finished lower level), that was listed for sale in January 2011 at $539,900 and sold for $492,500
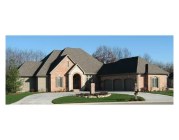

- 51580 Wexford Drive in Granger’s Waterford Green, a 2,990 square foot 4 bedroom, 3+1 bath home listed for sale in January 2011 at $445,000 that sold for $406k. It last sold in August 2008 for $423k
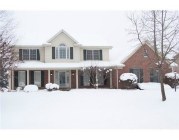

What is the average selling price in Twyckenham Hills or Scottsdale?
KF-
Here are the quick answers from the MLS:
Twyckenham Hills
34 sales since 1/1/2010
low: $41k
high: $250k
average $86,757 / median $82,750
Scottsdale
27 sales since 1/1/2010
low: $24,100
high: $112,900
average $74,146 / median $74,900
Remember that each neighborhood has more and less desirable areas, and locations that impact price considerably (e.g. backing to a highway). That lessens the usefulness of average numbers, but they are a good place to start a neighborhood analysis. Also note my standard caveat, “Don’t make financial decisions based on a blog post.” If you want more help understanding these neighborhoods, e-mail me.
I wonder who dropped the half-mil in cash on the ND ave property.
DC,
You can do some research here:
http://www.stjosephcountyindiana.com/departments/SJCRecorder/default.htm
http://in-stjoseph-assessor.governmax.com/propertymax/rover30.asp?sid=AE8F3831BC4740ECAC78167E74B0F4FF
Very cool links. Thanks for the info!
Thanks, Nick. I was just curious. I live in Twyckenham Hills and have absolutely NO INTENTION of selling. I LOVE this area! Having lived in Granger, I think it is every bit as nice (if not nicer due to having city utilities), and the Ireland Rd. conveniences are a nice perk. I rarely have to go to Grape/Main. I LOVE that! If I wanted those kinds of traffic headaches, I would have stayed in Chicago! 🙂
By the way, if you ever need someone to speak on behalf of the 46614 zip code to prospective buyers, I’d be MORE than happy to help. This is such a wonderful community out here.